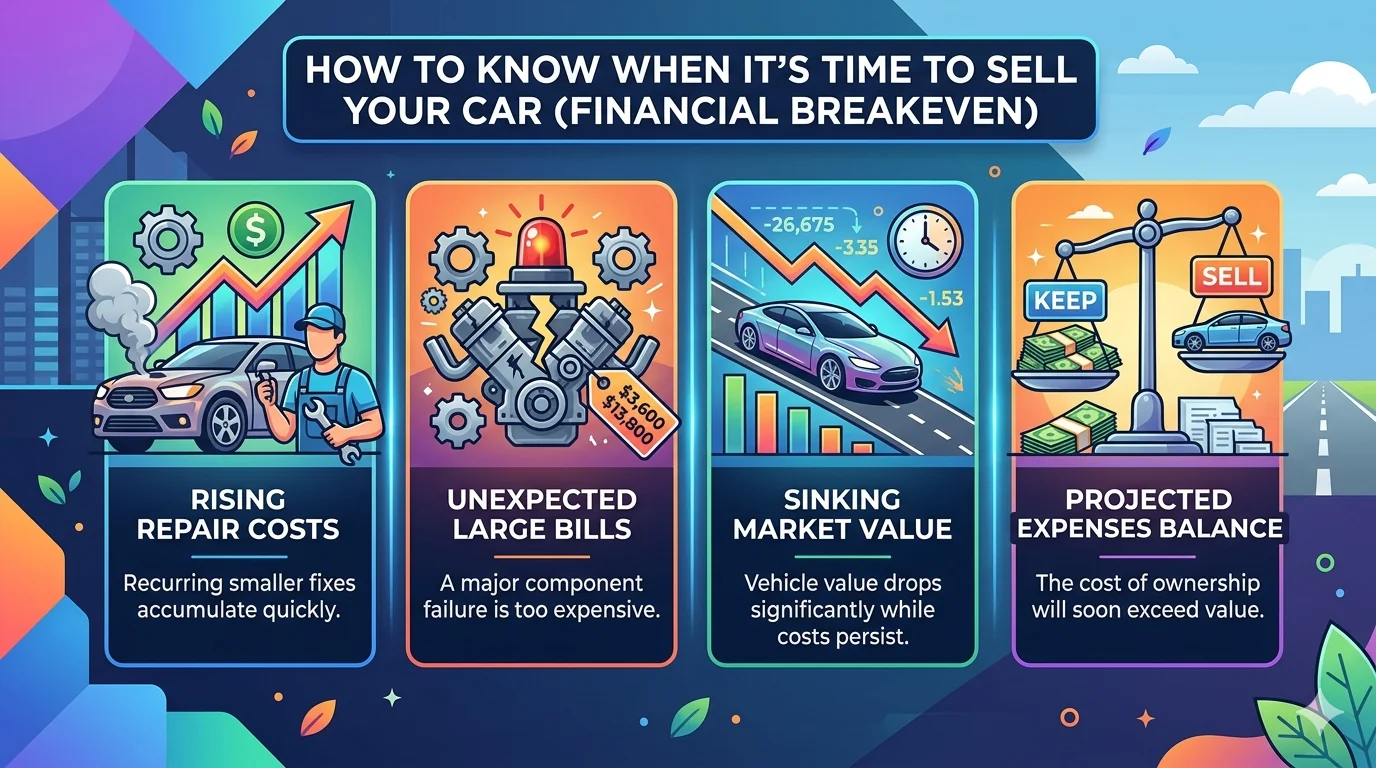
How to Know When It's Time to Sell Your Car (Financial Breakeven)
In this article
- Step One: Establish Your Vehicle's True Market Value
- Step Two: Calculate Your Remaining Loan Balance and Equity Position
- Step Three: Project Your 12-Month Repair Costs Realistically
- The Keep-vs-Sell Comparison: Running the Numbers
- The Repair Cliff: When Cumulative Costs Exceed the Vehicle
- How Depreciation Curves Affect the Decision
- Seasonal Timing: When You Sell Matters
- Trade-In vs. Private Sale: The Full Comparison
- When Negative Equity Makes Keeping the Car Smarter
- Making the Final Call
- Related Buyer Guides
- Compare and Apply
Check Your Options in 3 Minutes
No credit impact. All credit situations welcome.
★★★★★ 89+ Google Reviews · AMVIC Licensed · Free Delivery 300km
Your mechanic just handed you a $2,800 estimate. Your car is worth maybe $8,000 on a good day, you still owe $4,500 on it, and you've already spent $1,900 in repairs this year. Do you pay the estimate and drive it another year? Trade it in and roll the negative equity into a new loan? Sell privately and start fresh? This is the keep-vs-sell decision, and most people make it on gut feel when there's actually a clear mathematical framework for it. Let's work through the numbers.
See what you pre-qualify for
Three quick answers — soft check, no commitment.
Step One: Establish Your Vehicle's True Market Value
Before any other calculation, you need a realistic number for what your vehicle is worth right now — not what you paid, not what you think it should be worth, not the asking price on Kijiji for identical vehicles. The actual selling price.
The most reliable approach is to check three sources simultaneously:
- Canadian Black Book (canadianblackbook.com) — the industry standard for Canadian market values. Lenders use this. Dealers use this. This is the number that matters for financing conversations.
- Kijiji and AutoTrader completed sales — posted prices are aspirational. Look for vehicles that have been relisted multiple times (price dropped) to understand what the market is actually paying.
- Dealer trade-in offer — get a real appraisal from one or two dealers. It's free, takes 20 minutes, and gives you the wholesale floor: the minimum your vehicle is worth to the market.
The spread between private sale value and trade-in value is typically $1,500–$4,000 depending on vehicle type and condition. A private sale gets you more cash but requires time, safety, and negotiation. A trade-in is faster and cleaner but captures less value. Understanding that difference is part of the decision.
Step Two: Calculate Your Remaining Loan Balance and Equity Position
Call your lender or log into your financing portal and pull your current payout balance — not the remaining payments, the actual amount required to discharge the loan today. These are different numbers because of how amortization works in the early years of a loan.
Now do the simple subtraction:
Market value − Payout balance = Equity position
If market value is $11,000 and payout is $8,500, you have $2,500 in positive equity. You have room to maneuver. If market value is $11,000 and payout is $13,500, you're $2,500 underwater (negative equity). That changes the math on a trade-in significantly.
If you're in a negative equity situation, selling doesn't make the debt disappear — it either needs to be paid out of pocket at private sale, or gets rolled into a new loan at a dealer trade-in. Neither is inherently wrong, but both have consequences that need to be modelled before you commit.
Step Three: Project Your 12-Month Repair Costs Realistically
This is where most people's math goes wrong. They look at the current estimate and compare it to monthly payments on a new vehicle. But the right comparison is: projected total repair spend over the next 12 months vs. 12 months of payments on an alternative vehicle.
To project 12-month repair costs, you need to be honest about:
- What's on the current estimate, and is it deferred (optional now, critical in 6 months) or urgent?
- What other items has your mechanic flagged as "watch this" — meaning they're not critical today but will be in the near term?
- What's the vehicle's track record? One expensive repair year might be anomalous. Two or three in a row is a pattern.
- For higher-mileage vehicles, a useful benchmark: maintenance costs on a vehicle over 200,000 km often run 15–25 cents per km once you account for all inputs.
Build a realistic estimate, not an optimistic one. Most people underestimate forthcoming repair costs by 40% because they only count confirmed issues and ignore "watch items" that reliably become confirmed issues within 12 months.
The Keep-vs-Sell Comparison: Running the Numbers
Here's the framework in table form. Let's use a real-ish scenario: a 2018 Ford F-150 with 195,000 km, currently worth $22,000, payout balance of $9,500, facing a $2,400 repair estimate (front ball joints and rear shocks), plus a mechanic flag on the rear differential that'll likely need service within the year (~$800).
| Factor | Keep It | Trade In | Private Sale |
|---|---|---|---|
| Current market value | $22,000 | $18,500 (trade) | $22,000 |
| Payout balance | $9,500 | $9,500 | $9,500 |
| Net position | +$12,500 equity | +$9,000 equity | +$12,500 equity |
| Immediate repair cost | −$2,400 | $0 | $0 (sold as-is) |
| Projected 12-mo repairs | −$800 (diff service) | $0 | $0 |
| Monthly payment (existing) | $320/mo × 12 = $3,840 | New loan TBD | $0 (paid out) |
| Total 12-mo cost | $7,040 (payments + repairs) | New payments TBD | N/A |
For the Ford F-150 in this scenario, keeping it actually makes financial sense — the vehicle has strong equity, and $3,200 in repair costs is well below the cost of stepping into a new loan on a comparable truck at current prices. But flip the numbers slightly — vehicle worth $11,000, payout $9,500, $3,200 in repairs — and keeping it becomes much harder to justify.
The Repair Cliff: When Cumulative Costs Exceed the Vehicle
The repair cliff is the point where the sum of recent and projected repair costs approaches or exceeds the vehicle's market value. This isn't a bright line — context matters — but it's a useful mental model.
A vehicle worth $7,000 that needs $6,500 in repairs over the next 18 months is approaching the cliff. Even if those repairs extend the vehicle's life, you're putting nearly full-replacement value back into an asset that will continue to depreciate. Every dollar you spend on that vehicle produces less future value than the dollar you spent.
Two specific patterns signal cliff approach:
- Systemic failure mode: When one major system starts failing (high-mileage automatic transmission, rusting subframe, seized brake components), it rarely fails in isolation. The diagnosis is usually an indicator of broader neglect or wear.
- Asymmetric depreciation: Some vehicles depreciate slowly and hold their value even at high mileage (Toyota Tacoma, Honda Civic, Subaru Outback). Others fall off a cliff past 200,000 km because the market simply won't pay. If your vehicle is in the latter category, the repair justification arithmetic changes faster.
How Depreciation Curves Affect the Decision
Depreciation is not linear. New vehicles lose the most value in the first 1–3 years, then the curve flattens for most mainstream vehicles. This has a counterintuitive implication: if you're currently driving a 5–8 year old vehicle, you've already absorbed the steepest depreciation. Replacing it with another vehicle of similar age means you're entering someone else's flat part of the curve — not necessarily getting a better deal.
The math changes if you need to upgrade for legitimate reasons: your family grew and the vehicle no longer fits, your vehicle can't handle a new job's requirements, or you've moved somewhere that demands AWD you don't have. These are valid triggers. But "I'm tired of it" isn't a financial argument — it's a preference argument with a real dollar cost.
The trade vs. repair guide breaks down how to evaluate this for specific vehicle categories and age bands.
Seasonal Timing: When You Sell Matters
Vehicle demand in Alberta follows predictable seasonal patterns, and selling at the right time can shift your outcome by $1,500–$3,500 on trucks and specialty vehicles.
| Vehicle Type | Peak Demand | Weak Demand | Premium at Peak |
|---|---|---|---|
| Trucks (work and half-ton) | September–November | February–March | $1,500–$3,500 |
| SUVs and AWD vehicles | October–November | March–April | $500–$1,500 |
| Sedans and commuters | March–May | December–January | $300–$800 |
| Convertibles/sports cars | April–June | October–December | $1,000–$2,500 |
| Winter beaters | October–November | June–August | $200–$600 |
If you're planning to sell privately, timing the listing to hit peak demand for your vehicle type is a free way to improve your outcome. Listing a used truck in February is working against you. Waiting 6–8 weeks to hit the fall purchasing surge often recovers more than you'd spend in 2 more months of payments.
Trade-In vs. Private Sale: The Full Comparison
The decision to sell your car privately or trade it in is a tradeoff between dollars and time/effort.
Private sale advantages: You typically net 15–25% more. On a $20,000 vehicle, that's $3,000–$5,000 — real money that meaningfully reduces your next loan amount.
Private sale disadvantages: You're responsible for safety inspection (required in Alberta for private sales), advertising, dealing with lowball offers, safety, and paperwork. It takes 2–6 weeks on average. You also need to bridge the gap between selling your current vehicle and taking possession of the next one.
Trade-in advantages: Done in a day. The dealer handles all paperwork. GST is calculated on the net price after trade-in allowance, which reduces your tax bill — on a $30,000 purchase with a $10,000 trade, you only pay GST on $20,000, saving $500 in tax.
The GST offset is often underestimated. For many buyers, the tax savings and convenience close the gap between trade-in and private sale value considerably.
When Negative Equity Makes Keeping the Car Smarter
If you're underwater on your loan and the vehicle is still mechanically sound, the math often favors staying put — at least for now. Here's why: trading in a vehicle with $4,000 in negative equity means rolling that $4,000 into your next loan. You're now paying interest on money from your previous vehicle on top of your new vehicle's purchase price. That $4,000 at 14.99% over 72 months costs you roughly $1,700 in additional interest. That's a significant penalty to escape a vehicle you're unhappy with.
The smarter play when underwater: continue making payments aggressively to build equity, do the required maintenance to protect the vehicle's condition, and time the trade when you've reached positive equity territory. Using the biweekly payment calculator to model accelerated payoff schedules often reveals that adding even $50/biweekly to your payment can move that timeline by 6–12 months.
If you're using a tax refund or bonus to bridge the gap and get to a better equity position, that's a legitimate strategy. The trade-in value preservation guide covers the specific steps — documentation, condition work, service records — that maximize what you'll receive when you do trade.
Making the Final Call
Run this checklist before deciding:
- What is the realistic 12-month repair projection (current estimate + flagged items + statistical wear)?
- What is my actual equity position (market value − payout)?
- If I trade, what will my new monthly payments be, and what's the total 12-month cost including any rolled equity?
- Is my reason for selling financial, practical, or preference-based? Only the first two justify the transaction cost.
- Am I in peak demand season for my vehicle type, or would waiting improve my outcome?
There's no universal right answer — but there is always a number-based answer. If you want to run this analysis with real lender offers on a replacement vehicle, start your financing application with us. We'll show you exactly what a replacement looks like monthly and total cost, so you can compare it directly against your keep scenario. Serving buyers throughout Calgary and across Alberta, our team is used to these conversations — and we'd rather help you make the right decision than the fast one.
Also worth reading: the trade-in appraisal guide breaks down exactly what a dealer is evaluating when they look at your vehicle, and the total cost of ownership framework helps you compare vehicles on a true apples-to-apples basis rather than just monthly payment.
Compare and Apply
- Bad Credit Financing — Complete Guide — financing for low credit scores
Financing Resources
Related Articles


Ready to Find Your Vehicle?
Browse our inventory or apply for financing. All credit situations welcome.
★★★★★ 89+ Google Reviews · AMVIC Licensed · Free Delivery 300km